Friday, November 30, 2007

Virtual Globe Sessions at AGU

If you are going to AGU this year, you may want to take a look into the current state of displaying geologic data by attending the sessions on virtual globes:

http://conferences.images.alaska.edu/agu/2007/schedulesess2.html

I will be there and will post anything I learn that is particularly relevant to geologic mapping.

Thursday, November 29, 2007

Exhibit on the History of Cartography

Check out this really cool site of the map exhibit at the Field Museum in Chicago:


Wednesday, November 28, 2007

Correlation Diagram In Excel--it works(!)

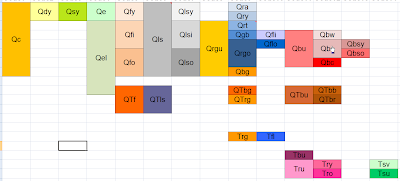
It is possible to develop a decent correlation diagram in Excel. This is an example of a single worksheet incorporated into a workbook with all of the other tabular data supporting a geologic map that I am making of the Owyhee River area, Oregon. Not only is this a good way to keep all of your data in one place (Arc 9.2 can incorporate Excel worksheets quite painlessly now), but this diagram can be directly linked to an mxd file of the map layout. This is a positive development for all concerned parties (the geology team and the cartography team). This sheet is stored amongst sheets that show the point codes, line codes, and unit codes and can be updated concurrently if you stay on top of it.

Note that there are not nearly as many color options in older versions of Excel. The diagram above was created in the newest version.

Collaborative Mapping in Google Maps

Google Maps has just introduced 2 useful things. The first is collaborative mapping in which you can jointly edit the same map with a selected group of users. The second is a kml import tool which allows you to import and export data to and from Google Earth. Sometimes Google Maps is a better option when you want to share a map widely and are mainly focused on point-data. I have been using it extensively for developing topical maps which highlight key geologic and scenic aspects of my study areas.

Note that the map below, though workable in the confines of the blog, is better viewed as a larger map (click the 'view larger map' at the bottom left).


View Larger Map

Sunday, November 11, 2007

Thursday, November 8, 2007

Google Map Example: Bouse Formation outcrops

This map includes locations and photos of key outcroppings of the Bouse Formation in southern Nevada, western Arizona, and southeastern California. Eventually it will be enhanced to include elevations, basic strat context and Sr chemistry where appropriate. I quickly put this together to reinforce the obviousness of using a virtual globe / map interface to evaluate this type of information.

Be sure to zoom in and view in sat or hyb mode. Note that a 'kml' file can be exported to view in Google Earth.


View Larger Map

Data Points in a Geodatabase

Stations (site specific data)

[kind] O = generic observation

[kind] A = age

[kind] G = graphic data

[kind] R = sample sites

[kind] Y = analytical


Age categories (prefix 1)

a = Argon-Argon

r = radiocarbon

t = tephrochronologic

c = cosmogenic
Graphic data categories

p = photograph

s = sketch
Sample site categories

r = rock


s = sediment

t = tephra

Analytical categories


f = fluvial transport direction

g = fluvial gravel lag

This is the structure of point data that we have built into the geodatabase for the Owyhee River mapping project. It covers all of the ground that is presently relevant to that project, but would need to be modified for a bedrock / structural map, for example.