Monday, December 29, 2008

Gigapan is the Man!

Of all the interesting things I learned at AGU a week or so ago, the utility of the Gigapan system for understanding and illustrating geology sunk in the hardest.

Ron Schott of Ft. Hays State University gave an excellent presentation that made this particularly clear. The gigapan system is elegant in its simplicity and it offers an avenue for simply depicting the elegant complexity (good one, no?) of huge geological vistas and outcrops. It even has an application for looking at very small things in a big way. Check out Ron's blog for some details.

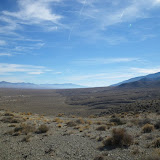
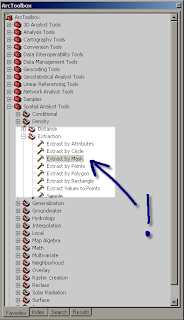
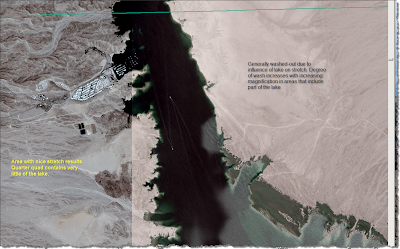
What is Gigapan? Well, it is a system for taking a panoramic photograph that is composed of many, many, small and detailed photographs. Presumably you have personally attempted to make your own pan photos, say, with a software package or with a built in camera function. Dare I say that you probably didn't wan't to try to stitch together more that 5, maybe 6 photos, right? You probably stopped at 3 or 4...like the image below:


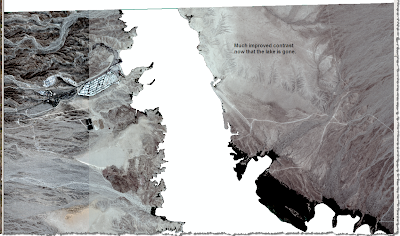
The Gigapan cranks this technique up a giganotch by stitching together 10s and 10s of high-resolution images into a...wait for it...Gigapan. The image below is a faked example to illustrate the difference between your approach and the Gigapan approach:


So. Why would you want to do this? Well, for one thing, it is totally cool. For another, it offers an exceptionally efficient way for exploring a large outcrop or geoscape. Once you have taken this series of images, stitched them together, and uploaded the result to the Gigapan site, you can view it at all levels of resolution. In the case above, you can bask in the glory of the huge stack of intracanyon basalt flows on the Owyhee River. Then you can zoom in and look at the complicated cooling structures in great detail. Then you can zoom in and check out the contacts between the flows. While you are at it, you can check out the thin beds of gravels sandwiched between the basalts, etc. etc.

While you are looking at the details, you can pull out images that illustrate some of the aforementioned features. These high-res thumbnails can then be tagged and described for your colleagues to check out. They can then do the same thing and point out obvious stuff that you missed.

I already have my Gigapan gear en route. It works with my existing digital camera collection and is shockingly cheap. Stay tuned for some obvious examples of the application of this to geological studies. Also, stay tuned for the NeGIGAvada project...it is coming. Or should it be GIGAvada?

Monday, December 22, 2008

Abstract and Slides from Dr Jerque's recent talk

Digital Geologic Mapping and Integration with the Geoweb: The Death Knell for Exclusively Paper Geologic Maps
The combination of traditional methods of geologic mapping with rapidly developing web-based geospatial applications ('the geoweb') and the various collaborative opportunities of web 2.0 have the potential to change the nature, value, and relevance of geologic maps and related field studies. Parallel advances in basic GPS technology, digital photography, and related integrative applications provide practicing geologic mappers with greatly enhanced methods for collecting, visualizing, interpreting, and disseminating geologic information. Even a cursory application of available tools can make field and office work more enriching and efficient; whereas more advanced and systematic applications provide new avenues for collaboration, outreach, and public education. Moreover, they ensure a much broader audience among an immense number of internet savvy end-users with very specific expectations for geospatial data availability. Perplexingly, the geologic community as a whole is not fully exploring this opportunity despite the inevitable revolution in portends. The slow acceptance follows a broad generational trend wherein seasoned professionals are lagging behind geology students and recent graduates in their grasp of and interest in the capabilities of the geoweb and web 2.0 types of applications. Possible explanations for this include: fear of the unknown, fear of learning curve, lack of interest, lack of academic/professional incentive, and (hopefully not) reluctance toward open collaboration. Although some aspects of the expanding geoweb are cloaked in arcane computer code, others are extremely simple to understand and use. A particularly obvious and simple application to enhance any field study is photo geotagging, the digital documentation of the locations of key outcrops, illustrative vistas, and particularly complicated geologic field relations. Viewing geotagged photos in their appropriate context on a virtual globe with high-resolution imagery can be an extremely useful accompaniment to compilation of field mapping efforts. It can also complement published geologic maps by vastly improving their comprehensibility when field photos, and specific notes can be viewed interactively with them. Other useful applications include GPS tracking/documentation of field traverses; invoking multiple geologic layers; 3-D visualizations of terrain and structure; and online collaboration with colleagues via blogs or wikis. Additional steps towards collaborative geologic mapping on the web may also enhance efficient and open sharing of data and ideas. Geologists are well aware that paper geologic maps can convey tremendous amounts of information. Digital geologic maps linked via a virtual globe with field data, diverse imagery, historical photographs, explanatory diagrams, and 3-D models convey a much greater amount of information and can provide a much richer context for comprehension and interpretation. They can also serve as an efficient, entertaining, and potentially compelling mechanism for fostering inspiration in the minds of budding (and aging) geologists.

Check out this SlideShare Presentation:
Geofroth at AGU 2008
View SlideShare presentation or Upload your own. (tags: geology geotagging)

Monday, December 1, 2008

Captain Obvious Reviews his Transect

As a follow-up to recent and elementary post about how useful Google Earth is for field mapping, check out the traverse that I actually made:


Also, check out the online photo album that I created from the geotagged images shown on the snippet above:

Lower Walker River


If you don't think these technologies are useful, you may need to seek counseling.

Attribution ADD for you and me

Howdy Dummies. Are you like me? Do you get so wrapped up in mapping lines on high-res imagery that you fail to judiciously attribute them? You know, that 'oh man, I can just keep mapping this obvious contact until it disappears' feeling. Do you do the same with label points (you do use label points, right?)? Well, you can control your attention deficit by selecting a key option in Editor>Options interface:

Once you select the correct attribution option, you will be interrogated by the program as to what the attribute of the feature you just created is. Yes, you will have to make the call then. You really don't have time for that second, or third, or fourth sweep through the map do you? Do it right the first time. Be particularly judicious about your label points since those are much harder to formulate well after the fact.

I had no idea this option was available until fairly recently. If you knew of it, way to go. You are less of a dummy than I.

Wednesday, November 12, 2008

Captain Obvious Says: Google Earth is useful

File this one under the hilariously obvious. I am preparing for a 2-day outing for some reconnaissance along the range front of the Wassuk Range near Walker Lake. The piedmont there is an amazing plexus of massive, bouldery debris flow fans, multiple shorelines, and multiple Quaternary fault strands. It is an exceptional place to check out in real life and in Google Earth. In preparing my crap for the field, it dawned on me that instead of stupidly taking my computer in the field with a bunch of cached data, I could just print out some key perspectives on the areas I planned to visit. Duh. Despite being obsessed with hi-tech devices, I really do not like carrying a computer in the field. Also, I have never been one to enjoy using a stereoscope in the field, so this is an obvious solution.

If you have Google Earth Pro, you can save some nice high-res images (there are others ways to get them...) and doctor them up a bit for clarity and contrast. Check out the image below:


Thus, I will use this as one of my base images while mapping in the field. Isn't this obvious? Doesn't it look like a cool area to get paid to hike around in?

I am sure you know that you can overlay high-res geotifs in Google Earth if the existing base imagery does not meet your needs.

Tuesday, October 14, 2008

The Ultimate Digital Tool for Dummies and Luddites?


Imagine an ink pen that ~instantly converts your field notes into digital data. That's right. An ink pen that simply, and nearly instantly, converts all you have written into your field book into a digital notebook. There is one, I have tested it, I really like it, I have no reservations about recommending it. There are few reasons not to use it.

The pen and field book combo is made by Adapx. Through a complex combination of sensors in the pen and embedded patterns (Anoto pattern) in the paper (in this case, an actual Rite in the Rain field book), the pen's brain keeps a precise record of all the strokes it has made during the day. Once the day has ended, plug the thing into your computer and it uploads all the pages of notes. The latter, and most important step, requires that you use Microsoft OneNote software. This is not a dreadfully negative factor, however. The software is surprisingly useful.

The screen clipping below shows an example of the digital data pulled off of the pen. This (for what it is worth) does look precisely like my handwriting. The sample below is from a recent field stint on the Owyhee River. The embedded image and clean text were added later using simple tools in OneNote. (Read about OneNote here)

Also, OneNote can attempt to convert your handwriting to text. It does a fair job depending on your penmanship. At the very least, it gives you a decent start on converting your chicken-scratches.
The example above shows: 1. Field notes, 2. OneNote conversion, 3. Corrected note (with mistake, whoops)

Geologic mapperz stay tuned. This device is also designed to allow you to draft on to paper maps, yes paper maps, and automatically convert your analog mapping to digital mapping. It works with ArcGIS (must have the .NET framework installed) and has lots of promise. I will be testing this application in the field soon.

Notes: the pen and OneNote add-on cost me $300. Battery power is good for more than 1 day. The ink used by the pen is Rite in the Rain's proprietary ink. It gets a little thick in the cold. I would kill for a pencil, my preferred note taking device. Alas.

Friday, September 26, 2008

Masking the lake for a good stretch

If you make your geologic maps using ArcGIS and work with nicely detailed color imagery, then you already know how useful a stretch is. If not, check this previous posts for dummies:


Now that you are back up to speed, I will share a simple trick I figured out by brute force that eliminates areas that may skew your stretch in an inconvenient way. Namely, large bodies of water. Right now, I am supposed to be finalizing mapping in the Spirit Mtn NW quad which includes parts of Nevada, Arizona, and Lake Mohave. Mapping along the lakeshore in the field is a joy; whereas compiling along the lakeshore is a pain in the neck...particularly when you use the standard deviation stretch restricted to the 'current display extent' which is usually the best option for contrast enhancement. The problem is caused by the black hole of lake pixels that dominate the statistics. The solution? Mask out the lake in a new raster using the 'extract' tool:


Here are the results from my current map area:

Before:

After:


Epilogue. Someone with considerably more knowledge in GIS than I once explained to me how I could do this with raster math. I screwed around with that and failed. After numerous scans through Arc Toolbox (haven't you scanned that stuff over and over looking for something?), I finally found some commands that sounded useful. Remember, this is digital geoscience for dummies.

Monday, September 22, 2008

How to eat GeoSpaghetti

Geologic mapping can span many scales of time and space. Some of the most complex linework can result from evaluating a fluvial system in great detail in a small area and over a geologically instantaneous period of time. In my case, this scenario corresponds to the Bill Williams River in Arizona. For several years, I have been compiling detailed geologic maps of channel change on that river since 1953. The result? A heaping plate of GeoSpaghetti.

The image above is an excerpt from a 35 mile stretch of river. Yes. The river has undergone some profound changes in the last 50 years or so. Exactly how and why is beyond the point of this blog. One day I will publish it if it matters to you.


The point of this entry is to describe the various tools and methods that I have employed in ArcGIS to compile the lines in a meaningful way and to turn the resulting spaghetti into a meaningful map or series of maps.


The Project:

Map the bottomland geomorphology of the Bill Williams River at specific points in time using a chronology of orthorectified aerial photographs. At this point, I have mapped six generations of the valley bottom. The resulting plexus of lines is a logistical nightmare to a certain extent, but I believe I came up with a reasonable way to deal with them. If you map similar things and have better ideas or suggestions, please let me know.


  1. Set up a geodatabase...yes you need to know the basics of this fundamental operation. Add your lines as classes in a geology feature dataset.
  2. Determine a boundary to which you will be mapping and stick with it. Note that as you map different generations of lines, you will want to alter the boundary...you just will. However, unless it is a major issue and you will diligently propagate that alteration through all of your line layers, resist the temptation
  3. Develop a line and polygon attribution scheme that is flexible and systematic. Important: this scheme needs to be logical and transferable to each generation of linework. Certain generations may require specific types of lines and polygons, but try to adhere to a common conceptual base so that it makes sense all the way through. Record the nomenclature in a spreadsheet and update it when you inevitably revise or add to your units. The spreadsheet can be a life-saver if you tend to work on too many projects and put this one down for a few months.
  4. Begin mapping the earliest generation of photograph if possible. It is best to map the images in chronological order for reasons that will soon become clear. Map lines NOT polygons. Starting with polygons is whacked. You can build them from lines in a matter of seconds.
  5. Once the earliest generation is mapped (and you have attributed the ‘proto’ polygons with a point feature class...post coming if this is news to you) and the topology is all correct (you did build and check the topology, right?) copy it and rename it. Use this dataset as a starting point for the next generation of photos. Note: the tediousness is about to set in or get worse.
  6. Yikes. Your map is already a mess. Now you need to mesh the data in a logical way. You have added lines that preclude the existence of some of the previous generation’s lines, right? All of the precluded lines need to be removed (don't worry the originals still exist...remember, you copied them).
  7. Luckily, you have already built and analyzed the topology of your first layer, right? Well now build and analyze the topology of the second layer for laughs. The only rule you really need is the ‘no dangles’ rule. If you have the topology built and analyzed, you can use the ‘Planarize’ tool to break selected lines (even all of them) at each intersection. Then you can sweep through and select and delete all of the (now) superfluous lines.


That sounds easy right? It is easy, but really really tedious. Also, unless you have taken some preliminary precautions, you may lose all of your careful attribution. For better or worse, when you set up the geodatabase, you have many, many, options to ignore or address. Some of these are very useful to know about. One is ‘Default value’. What you choose here is the default attribution given to any piece of data that you enter. In the case of the Bill Williams map, setting the apyear (aerial photograph year) to the appropriate year was essential and useful. In other cases, I bet you can come up with some examples of your own where this would be useful.


You may also find yourself splitting and merging many lines. Unless you establish 'split' and 'merge' policies, you may get some disconcerting results...like total loss of attribution that you didn't find out about until you split 10s to 100s of lines:


It is best practice to attribute your geolines immediately upon drawing them unless it is really ambiguous and you have a firm follow-up plan. Thus, choosing a default value for a line that requires some scientific judgment may not be the best idea. In the (recent) past, I have had a tendency to map many lines without attribution, assuming that I will do it in a ‘second pass’ through the data. Yikes. That is really stupid. For one thing, once you have drafted the line, you have covered it; for another, the ‘second (or third) pass’ idea isn’t very efficient and just effing snowballs up on you.


So what to do?


Option 1: Diligently attribute each line after you draft it.

Option 2: Have the program force you to attribute the line, or point, or poly, once you draft it.

Option 2 is the most efficient way to go. I just discovered this one.


Stay tuned for updates as to the progress of the Bill Williams River map...polygons coming next.

My new digital love, the cheap and rugged Laser Range Finder.


A few years ago, a geopal of mine turned me on to the 'magic box'...a laser rangefinder from LaserTech Inc. It was a little bulky and came in a box so padded that you were reluctant to keep it out of it for long...also, it cost several $1000. Nonetheless, I coveted that device from afar and borrowed it for several months.

On a more recent excursion, a different geopal pulled out a nifty little yellow number from LaserTech that made all of the same measurements (slope distance, vertical distance, horizontal distance, inclination, height) but came in a much smaller, more rugged package.

Turns out they got the thing on my advice several months prior when I scoffed at their use of a Jacob staff to measure several 100 meters of section (flat-lying rocks). More importantly, it turns out that the smaller, more rugged version is also less than $1000!

Damn right I got one. Maybe you should have one too. This little number could change your life if you sketch a lot of strat sections and guesstimate unit thicknesses or otherwise conjure up various spatial dimensions on the fly. With a little extra thinking, you can also construct an accurate cross section in the field if you are so inclined.

I used mine in the field over the weekend and was thoroughly satisfied with the results.

Friday, September 5, 2008

Geo-Rant: My Quads are killing me (and wasting tons of time)!!


No, not because I spend so much time hiking in the desert or because I lugged way too much crap down the South Kaibab Trail last month...not those quads. What is killing me is being a victim of mapping 7.5 minute quads. Mapping 7.5 minute quads is a waste of time. It is efficient only in a clerical sense, not in a scientific sense. Mapping on the basis of 7.5 minute quads amounts to mapping in a rectangular frame with boundaries that are (aside from some amazing coincidence) completely arbitrary with respect to geology.

Obviously, the implied goal of mapping 7.5 minute quads is to allow for a systematic framework for eventually mapping a bunch of officially circumscribed rectangles that cover an entire state or region. The key words here are 'officially', eventually', and 'rectangular'. Morevover, the concept of mapping quads is so deeply mired in the deeply pre-digital history of the USGS and the history of printing that it has become an ultra-anachronism.

I have been foolish enough to map a patchwork series of quadrangles along the lower Colorado River in an attempt to better understand the river's geologic history. Each time I move into a new quad, I learn more about that history (or more variations on it) that inform previous maps. Why in the hell I didn't just try to get funding to map the deposits of interest along the corresponding length of river is beyond me. Eight years later, I am still trying to finish some of those maps (sure, I am a perfectionist, but there are other reasons).

My most ambitious mapping project, the Ivanpah Mega-Map (Ivanpaviathan), is a classic example of how mapping quads can (temporarily) wreck your life. In that case, I stupidly proposed to map the entirety of all of the quads that fell even partly into the boundary of the watershed of interest. WTF? What an idiot. That is how mired I was in the Quad Mapping Model (QMM). I paid and paid dearly for that bit of stupidity.

My job involves mapping a lot of quads in Nevada. My agency has a goal of eventually mapping the entire state. Ha! That is not going to happen at 1:24,000 in my or my kids' (or their kids') lifetimes. In fact, this is simply not going to happen ever! Deal with it. Pick the areas that really matter (for whatever reason you like) and map them. Don't worry, you can still circumscribe the area with a quadrilateral that has easily defineable corner coordinates....

Saturday, August 30, 2008

Huge thunderstorm in western Grand Canyon

A highlight in anyone's life, particularly a geomorphologist's. More proof that digital video can really complement geologic field work. Love that waterproof camera.

Resurrection / Superposition Rapid, Colorado River

In an ironic geomorphic situation, the Colorado River has formed a new rapid downstream from the mouth of the Grand Canyon near Pierce Ferry. Here, recession of Lake Mead has (obviously) induced incision by the river. The river adopted a new course that traverses some resistant beds in the Muddy Creek Formation. This video chronicles the vagaries of this rapid.

Friday, August 29, 2008

Love my Pentax Optio W60!

I splurged on a waterproof camera before a long trip down the Grand Canyon. Aside from assuaging my fear of taking pictures in the rapids, it also provided a great opportunity to film a ride through a classic river rapid wave train with large standing waves. Critical flow anyone?

Saturday, August 23, 2008

Who needs a waterproof camera? You do.

I have just returned from my grand hiatus and have lots of proof that waterproof cameras kick proverbial a*s. For example, check out this little video (with audio, no less) of bedload transport in Travertine Grotto:


Monday, August 4, 2008

Grand Hiatus

Greetings subscribers (all 3 or so of you). I am on hiatus for the next 3 weeks. I will be trying out my new waterproof / dustproof Pentax camera on a trip down Grand Canyon from Phantom Ranch to South Cove. Will be sure to provide some follow up. For now, check out some bedforms on the floor of the shallow part of Lake Tahoe. I am confident the camera will work on the river...

Monday, July 28, 2008

Geo-Rant: Geoscience 2.0..where the F is everybody?


Note: I have decided to pepper the blog with a geo-rant every now and then. My first is about my (hopefully horribly misguided) perception that geologists as a group are really missing the boat with Web 2.0 and web-based collaboration.

A colleague recently reminded me of an interesting article published in Scientific American several months back. It describes the great utility of open, web-based collaboration and data sharing for advancing science. The following is a snippet from the article by M. Mitchell Waldrop:
The first generation of World Wide Web capabilities rapidly transformed retailing and information search. More recent attributes such as blogging, tagging and social networking, dubbed Web 2.0, have just as quickly expanded people’s ability not just to consume online information but to publish it, edit it and collaborate about it—forcing such old-line institutions as journalism, marketing and even politicking to adopt whole new ways of thinking and operating.

Science could be next. A small but growing number of researchers (and not just the younger ones) have begun to carry out their work via the wide-open tools of Web 2.0. And although their efforts are still too scattered to be called a movement—yet—their experiences to date suggest that this kind of Web-based “Science 2.0” is not only more collegial than traditional science but considerably more productive.
Take a few minutes (sure, you're busy...so am I) and read this article in full. After reading it, I felt like some of my efforts in blogging and goading my colleagues to participate (to, alas, fairly little avail) in open and web-based collaboration were vindicated. Are you open to open science, or are you forever married to the old model? I started one research blog, Yeehow Central, in an effort to unite a small, active research group because I know that the concept has great potential in general. All my colleagues have managed to carve out some form of collaboration using email (good gawd!) but few if any are taking it to a higher, more productive level (blogging, real time group collaboration...e.g. check out Campfire...even IM/chat).

Is this not a painfully obvious way to go? I think so. I have devoted a fair amount of time to some very basic blogging at the very real risk of getting zero to hardly partial credit in my annual performance review. Why? Because it just seems so freaking obvious....is it just me and a few other neogeoheads / geogeeks? wtf?

Try something new. Sure you're way too busy to do something like this, so am I. We are all busy. We are all stuck in various rut or two. That's life. Is old school science and mapping going to rule your behavior for the rest of your career (or life for that matter)? Drag.

Friday, July 11, 2008

New GPS goodness!

Of note to geologists who are beyond 'impressing' their colleagues with field triangulation and traverses on horseback....


Today, Garmin announced the upcoming release of the 'Oregon' gps unit. This one, though pricey, looks to be a superior counterpart to the 'Colorado'. Of even greater interest to geoheads is the fact that there is evidence that 24k topomaps are also in the pipeline.


Here is a link to Garmin's mini-site: Oregon Gps Unit

Thursday, May 29, 2008

Hey Dummy...Quit ignoring GIS Servers in ArcCatalog

Ok. So I am not so smart...big surprise. It is digital geoscience for dummies after all, and I am a geologist, not a GIS-geek. At the DMT meeting last week I was able to have several head-to-heads with some well-trained ESRI representatives. I learned more than I can remember now, but the key thing I learned is the value of the network connection/ gis server function in ArcCatalog. Yes, I have always seen it and always ignored it. Whoops. With recent developments at ArcGIS online, you can link your mxd to various streaming sources of data. If you use ArcGIS, you need to check out ArcGIS online.

I started to get a whiff of this when using Topofusion (see previous posts) and, more recently, Global Mapper, because these programs can load imagery in the background of your project when you are online. Anyway, check this out:


The image above shows my Ivanpah Valley, NV megamap (the flood hazard version) at 1:250k with high resolution ortho imagery in the background. Also, check this out:


ESRI provides a decent data set of shaded relief for the globe. This is what southern Nevada looks like. The shaded relief looks considerably better when zoomed out over a larger region and makes a great overview map.

You can also 'be served' some pretty decent satellite imagery, as shown below:


So, how does this work? Pretty freaking simple. Create Network Connections in ArcCatalog. You just need to decide if it is an ArcGIS server, an ArcIMS server, or an WMS server. Then you simple add the server data source to your active project much as you would imagery or data hosted on your desktop computer. Of potentially great interest is the fact that you can connect to seamless.usgs.gov and choose the data type that you want to add from a long list.


Note: The high resolution imagery available at ArcGIS online is the new color NAIP orthoimagery (I'm pretty sure), so it is completely viable as a geologic mapping supplement. I wish I had known about this long ago. Being self-taught in GIS has its disadvantages. If any of the 4 people out there who may look at this blog know of any other online map services of value to geologists, let me know.

Thursday, May 22, 2008

Digital Mapping Techniques Meeting Post-Mortem

I attended the USGS-AASG sponsored 'DMT' meeting for the first time this year. I should have been attending this meeting for the last several years. This year, it was in Moscow, Idaho. I applied too late to give a talk, but forced myself on the audience anyway under the guise of a discussion.

Principal Take Home Messages (through the cynical filter of DrJerque):

1. Paper maps aren't dead, but they are dying, albeit slowly.
2. ESRI is coming to terms with the power and sway of Google Earth and kml
3. Existing USGS 24 k basemaps are no longer loved by all (and hated by some)
4. LiDAR kicks proverbial butt.
5. Some geologists still use Garmin 12xl GPS units....ouch!
6. Geotagging digital photos is still news to some.
7. Geologists are generally uninterested in carting computers around in the field.
8. Many state surveys still publish maps using graphic arts programs.
9. Archiving digital data is a major concern.
10. Geologic data standards are emerging. They need to be adopted.

Friday, March 28, 2008

Scan your slides or forget your past, old geologists

I recently realized that I had more than 1200 slides that I had taken in the field between about 1990 and 2001. For example, this insane waterfall I visited in Iceland in July 2000. I also realized that they were becoming distant memories as the years passed and the files from my digital cameras piled up on my hard drive. It was obvious that I was never going to see all or most of these slides again, so I took an evening to go through all of them, toss out the real losers, crudely organize the remaining 996 and send them to a service that scans and archives them to DVD at a cost that I could never, ever match. I chose www.digmypics.com where they scanned my many slides at 2000 dpi, burned them to DVDs (as full res tifs and medium res jpgs), archived them, printed out a thumbnail album, and mailed them back in less then a month for only $550! After having the digital results in my hot little hands for a couple of hours, I am convinced that it was money well spent.

If you are an aging geologist with a rich photographic slide archive, sit back and think about the likelihood that you are ever going to delve very deeply into it again. My guess is that you may never see most of them again. Have them scanned and you will be able to peruse every single one of them, otherwise they will just get more deeply buried, more disorganized, and ultimately fade away. Take a few minutes to think it over...once you have faded away, no one wants to go through your slide collection if it is not digital (at least probably not).
Posted by Picasa

Sunday, March 9, 2008

The geoscientific value of YouTube

Geomorphologists often speculate about what a desert flash-flood flow front / flood bore would look like. Turns out, not many of us have actually seen one in action. In this example from You Tube, some enterprising individuals went in the field to film some. This is entertaining and informative. You will immediately note the varying degrees to which the flow fronts are laden with flotsam and foam as well as complicated hydraulic interactions.

Visit you tube and search on 'geology' 'floods' and other key terms near to your heart and you will find, amongst the flotsam, some clips that have some true value to understanding surface processes. The 2005 tsunami helped open the door to this to some extent.

Also note that if you have a relatively new digital camera and a big memory card, you can create your own decent resolution footage in the field. Aside from instructional value, you may very well film a rare event one day.

Saturday, March 8, 2008

Better geo-digital living with RSS Readers

I bet you wonder about how in the world you can track all of the interesting developments in science and mapping on the Internet and then you become so frustrated that you blow the whole thing off. Obviously, my blog is not much help in terms of all of the possibilities, and it is likely that you are not interested in regularly checking on what Dr. Jerque is blathering on about this time. The obvious, obvious, obvious solution to this is to use an RSS reader. What is an RSS reader you ask? Just check this link: RSS explained. In short, it is essentially a program that aggregates updated information from websites and data portals on the Internet. The Internet 'feeds' can then be viewed within a simple interface, can be filtered by key words, and sorted thematically. Updated feeds are highlighted so you can see if anything new has shown up. I use a feed reader (yep, Google Reader ) to skim the Internet to find interesting things about digital mapping and the like.

If you install an RSS reader you can quickly subscribe to any site that you visit that includes one of these types of symbols:

You can subscribe to this blog (Geologic Froth) by selecting the previous link or clicking the relevant button in the url bar. That way you can see if I have added anything new without actually going directly to the blog (i.e. determine if it is worth your time to go to the blog at all).

What is most interesting for scientists is that you can subscribe to RSS feeds provided by numerous publishers that show the recent Table of Contents from various journals. The UNR library has collated a list of these (scientific journal rss ), and there are more. Ideally, all journals will eventually do this since it is a very efficient way to inform the scientific community about current research. Once you subscribe to various feeds of interest, you can filter the feeds for key words. You can also subscribe to news feeds that are filtered by topic (e.g., Nevada geology). There are also RSS feeds from the USGS that report recent global seismic activity.

Check the UNR library site for some very useful and concise information about RSS feeds.

http://www.library.unr.edu/rssfaq.html

Also, I use Google Reader to populate the boxes on the blog that contain links of interest (Fresh Geofroth and Fresh Cartofroth). That is a pretty handy set-up as well. Click 'Read More' in one of those boxes and you will learn how to subscribe to the related RSS feed for that particular brand of froth. Cool? yes.

Can you believe what you have been missing? Take 10 minutes to figure it out. You have the time, come on....none of that 'I am far too busy' crap.

Wednesday, February 27, 2008

The Wells, NV eq in Google Maps--More proof of the utter obviousness of online maps for Geologists


View Larger Map

This map is the effort of the Reno Gazette-Journal using USGS and UNR/NSL data. Shouldn't this map be embedded on on the NBMG website?

Saturday, February 23, 2008

Creating virtual context for geologic maps

Geotagging photos, diagrams, and map excerpts is an excellent way to aid in illustrating stratigraphic and geomorphic relations to colleagues. I have recently been doing field work in the Lake Mohave area and have photographed some key outcrops (see related posts here and here) that may be of interest to colleagues who are also trying to understand stratigraphic relations along the lower Colorado River. The slide show below includes those photos and illustrates another way to share geodata online.


Want to see the images on a map? Click this link and then you can view as online photo album or you can view it in Google Earth for the full effect. In cases where high resolution imagery is available, it only takes a little geo-imagination to comprehend the context of the image. No match for a field trip per se, but I think that it is one hell of a lot more illustrative than a discussion over the phone or showing a slide in a talk if you are simply trying to share information about a key outcrop.

I am currently experimenting with integrating several of my projects with online geotagged photo albums that include annotated stratigraphic diagrams, photos, and geologic map snippets. This is in the interest of developing quasi-interactive geologic data sets available for online evaluation, commentary, and review.

Friday, February 1, 2008

Captain Obvious says: 'Geotag your photos'

Geotagging photos of key outcrops or geoscapes in the field is a very useful thing to do. To geotag a photo is to inscribe the digital file with geographic coordinates. Lots of people are doing it, but I fear that not enough geologists are.

All photo files from digital cameras have an exif header. This stands for 'exchangeable image file format' and it is the area where the file name, date, time, exposure, etc., info is stored. Recent interest in digital mapping has lead to the ability to add specific geographic information (i.e. geographic coordinates) to the exif header. This offers great potential to the field geologist. There are various ways to geo-tag a photograph. Up to now, my preferred way has been to use the free photo-sorting program Picasa (yup, a Google product...more on this at related post) wherein you can manually link a photo to a specific location by dragging it to the map. This works fine in many situations, but can be tedious. Over the last couple of days, I have experimented with a more automatic approach using a program called 'Geosetter' which very efficiently and easily geotags my field photos by directly linking their time-stamp with a corresponding GPS tracklog. Brilliant! In this way, you automatically create a geographically accurate set of field photographs. If you use Google Maps, Picasa, or Google Earth, you can then display the images on a base map of your choice.

Check out an example I made using a Picasa Web Album:

http://picasaweb.google.com/drjerque/SMNW


Once at the album, click the 'view map' link. Be sure to zoom way in using the satellite mode to fully appreciate how useful this application is. Furthermore, consider the fact that some of your field photos may be of great value to other geologists, botanists, historians, etc., at some point in time. By tagging them with key words, geo-tagging them, and making them available online, you may be doing a great service to other scientists. Burying them in a paper archive or on a CD somewhere does no good.

Note, you can use Picasa to geotag your photos one-by-one through a link with Google Earth, using a simple drag-and-drop procedure. At some point it is obvious that digital cameras will automatically stamp the file with the coords, but I think the linkage between digital photos and a GPS tracklog may be the best way to go.

Thursday, January 31, 2008

GPS Tracklogs for Dummies

In order to learn more about tracklogs on your GPS, simply break down and read the short manual that came with the unit. If your unit is more that 3 years old or uses more than 2 AA batteries, you should upgrade. One important consideration is upgrading to a unit that has a memory card slot. In that case, you will be able to store considerably more data. In the case of my Garmin GPS 60csx, interacting with the memory card is actually easier than interacting with the unit. Also, it automatically creates individual logs on a per day basis. Very handy.

Please, please (!) rid yourself of the belief that you need to turn the unit off all of the time to save batteries. Newer units can run for 2-4 days on a single set of batteries when turned on and off at the beginning and end of the field day. If you are worried about wasting batteries, then use rechargeable ones and move on, man. In order to maximize the value of the track log, the unit should remain on during the entire day (except during lunch, when you change batteries, or when you are mapping underground).

A colleague at NBMG recently turned me on to a very handy program from the Minnesota Department of Natural Resources that easily converts GPS tracklogs and waypoints to shapefiles to use in GIS software. The program is called DNR Garmin and is extremely handy. Kudos to the author. The program can suck data right off the unit or can read from a gpx file. The image above is proof that it works.

Wednesday, January 30, 2008

GPS Tracklogs...use them.


I have spent the last 7 days doing field mapping in southern Nevada and fine-tuning some new and simple digital methods. Namely, using the GPS tracklog capability to document my progress, augment my note-taking, and the really cool application of automatic geotagging of field photos (look for related post about that).

GPS tracklogs: Why?

As a field geologist I am enamored with a tool that automatically knows my position in my map area. The handheld GPS is the most useful tool for geologists that has come around in a long time. If you don't use one and prefer to eyeball or triangulate your position the old fashion way, then grab your slide-rule, get on your horse and have at it.

Most of us already know that GPS is great to establish specific waypoints of key observations and sample locations, for example. A GPS tracklog is one step better in that it represents an accurate and complete record of an entire traverse over the course of a day, days, or weeks. Not only is this a useful method of documenting/demonstrating your progress in the field, but it also serves as an important complement to note taking. Once you have traversed a section of your field area, the tracklog will serve as a key reminder of your exact path. In your notes, if you often refer to what was crossed since the last formally recorded waypoint (i.e. SLO, or 'since last observation'), the track-log provides an accurate cartographic representation of exactly where you were since the previous observation (including backtracking to retrieve your forgotten rock hammer). Also, since the track-log can be tuned to record at very short intervals, you can even resort to recording the time of day to link field observations to your track log. Maybe that is too informal, but consider the point that this may be a way to make a quick observation at a time when you don't want to halt the traverse and formally record your position, etc., seeing that you are actually recording it anyway by recording the track log. Another short-hand approach relates to field photographs as described in a subsequent post.

Sunday, January 27, 2008

Do you manage your digital photos like a fool?

Are you the creator of an intricate directory structure in which you try to keep track of your digital photos? Have you actually saved multiple copies of a photo in order for it to be represented in relevant folders? I was once such a fool. For several years now, though, I have been using Picasa, a free and simple photo organizing program that allows you to tag your photos with key words instead of storing them in directories with key names. This turns out to be an extremely useful application if you have lots of digital photos. Tagging items with key words is superior to elaborate directory structures. Consider the following situation: You have a photo of a key outcrop in a specific map area that conveys multiple types of information. You can store that photo in a directory that is keyed to that map area and hope to remember that it also contains information relevant to other areas or geologic concepts.

Example from my work: Spirit Mtn. Northwest quad; Colorado River Sediment; Bullhead alluvium; erosional unconformity; sediment sample location.

What to do with this much information? By using tags in Picasa, I can store one copy of this image in a directory of my choice, but then tag it with all of those labels (likely shorthand versions like SMNW; Tcb; Unf; SSamp) so that all I have to do is search on the tag to find the image. Easy? Yes.


Picasa isn't the only program that does this, but I use it exclusively because I can so easily then link the photos with Google Maps, Google Earth, and any of my blogs (also, it is free). Be sure to check out the related post about geotagging photos and displaying them in a Picasa Web Album. The preceding screen-snag of the interface shows the basic layout. The circled area shows a compass rose icon indicating that the image has been geotagged and an arrow that indicates that it has been uploaded to a Picasa Web Album where the photos can be viewed in relation to the point from which they were taken in the field.

It should take you only 30 minutes to figure out how to use the program. Note that it will automatically search your computer for images and if offers some basic image editing functionality.

Sunday, January 20, 2008

AZ State Geologist Blog Links

I have known that Lee Allison, the state geologist of Arizona, maintains a blog for some time now. Today I noticed that he collated a nice set of links to other geology blogs:

http://arizonageology.blogspot.com/2008/01/geoblogosphere.html

This list is a refreshing indication that I am not the only geologist that thinks this is a useful thing to do.

I also noticed that the AZGS is being subjected to some budget cuts and pressures for reorganization. Something is in the air.

Saturday, January 19, 2008

Requiem for paper maps, continued.

I think it is important to consider the types advances shown below and their promulgation into all levels of popular culture as clear indications of transformation in the expectations of end users of maps of all kinds. The advances in 3D representation are particularly interesting.

Here are some links I found today that indicate various types of transformation in communicating and displaying geographic data:

Check this link to a recent article and video in the Wall Street Journal: Digital Maps

Check out this new GPS unit from Garmin: The 'Colorado'. This looks like a promising foray into the type of interface that would be particularly useful for geologists. I have been experimenting with a variety of gps field tools (palmtop computer, Panasonic toughbook) but I have the fewest qualms about simply using my Garmin 76csx. This new unit looks great to me.
Yes, I do want one....however, $599.


Follow the link below to see a lengthy presentation about virtual volcanology in Google Earth. The author is a strong proponent of using Google Earth in Geoscience, and presented at AGU's virtual globe session. The presentation is a bit long, but it reinforces the obvious point that Google Earth is an essential tool for geologists. Its potential for teaching geology is vast. The instructional value of you tube also comes across in this context. Stay tuned to this blog for an example of the value of new online presentation software as well.

Virtual Volcanology

Friday, January 11, 2008

Topofusion is Useful...check it out.

Topofusion is a very useful program that you may want to check out. It provides a handy and efficient interface for rapidly downloading and tiling topographic maps of a large range of scales, orthophotos, Landsat data, and other sources. The base images are collected from internet map servers as a background operation while you pan the program window. You can easily upload GPS waypoints and tracks into the program and quickly evaluate the position on a topo base that you are familiar with.

I used Topofusion to create this map which shows all of my foot traverses in my Owyhee River study area over the summer and fall. The program offers some interesting routines that generalize complex tracks to create a trail network that helps reduce irregularities and redundancies in GPS tracklogs. This is an easy way to show your progress in field reconnaissance if you are so inclined (yep, I am).

Recently, I used Topofusion to pan through a series of topo maps of the western United States to further investigate the geomorphology (and learn the names) of some very interesting geologic features I had seen on various airplane trips this last year (see related Google Map and Geotagged photo album). Topofusion was the best way to do this quickly because it provides very rapid access to all the detailed topo maps of the US which include many more place names than you can find in, say, Google Earth.

Wednesday, January 9, 2008

Reno-Gazette Journal makes good use of Google Maps

The hapless residents of Fernley, Nevada were recently struck by a flood of entirely human design when the canal that deprives Pyramid Lake of water failed into their neighborhood on an extremely cold and snowy morning.

Authors at the RG&J put together a Google Map to illustrate the effects of the flood. They also recently put one together to show snow and road conditions in the Lake Tahoe area. Good move.


View Larger Map

Sunday, January 6, 2008

Virtual Field Trip with Geo-tagged Photos

Another option for providing spatial context for geologically oriented photographs is to geotag them in an online photo album that links to a map. Here is an example made using Picasa, a very handy (free) photo organizing program that can geotag photos for viewing in Google Maps or Google Earth: Geotagged Photo Example

Very Basic Example of a Virtual Field Trip

As I have mentioned in previous posts, Google Map's 'My Maps' feature offers a way to very quickly develop some interesting maps that incorporate images and commentary. This is the most basic application. It is possible to make the interface considerably more elaborate with additional coding using an API--application programming interface. The example below is one that I put together with a few hour's work with photo editing and Google Maps. It highlights some scenic points on recent flights between Reno, Vegas, and Oklahoma City (although the scenery ends near Albuquerque). The potential for this to highlight geologic features of Nevada is obvious, no? It can even be made very technical to share with other scientists. I made mine for fun, but it could be augmented considerably with text on history and geology along with relevant links.


View Larger Map